
By Rahul Dhakate · PMP & PSM I Certified · 12 June 2026 · learnxyz.in
PMP formulas are one of the most feared topics in exam preparation. There are a lot of them, they use similar abbreviations, and under exam pressure it is easy to confuse CV with SV or mix up the EAC formulas when you cannot remember which one applies to which scenario.
CPM is fun but difficult at the same time — and I mean that genuinely. The Critical Path Method has an elegance to it once you understand how the network flows. But under time pressure, with multiple paths to calculate and float values to determine, it is easy to make small errors that cascade into wrong answers.
Table of Contents
Category 1: Earned Value Management (EVM) Formulas.
Variance Formulas — Negative is Always Bad.
Performance Index Formulas — Less Than 1 is Always Bad.
Category 2: Critical Path Method (CPM) Formulas.
Category 3: Communications Formula.
Category 4: Schedule Formulas.
Category 5: Procurement and Contract Value.
The Complete Formula Reference Table.
Memory Tricks That Actually Work
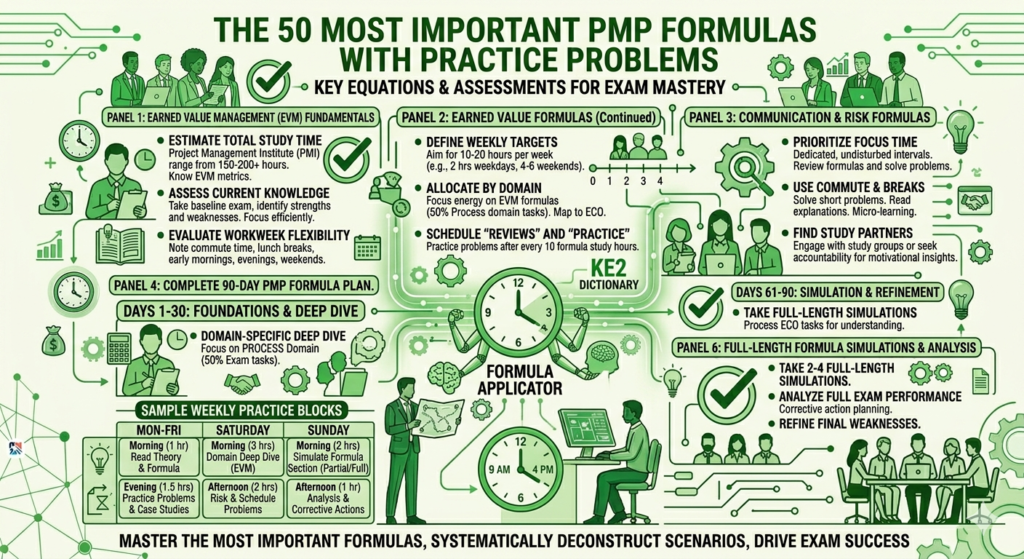
Here is the technique that helped me most: I wrote all the key formulas on a single sheet of paper and stuck it somewhere visible — in my case on the wall where I could see it every morning. Just reading through it once each morning, for 60 to 90 seconds, built the formulas into muscle memory over weeks without any deliberate drilling. By the time I sat the exam, the formulas were automatic.
This article gives you all 50 formulas organised by category, with plain English explanations and worked practice problems for the most complex ones. Use it alongside the formula wall technique and these formulas will stop being a source of anxiety.
Write all these formulas on one sheet of paper. Stick it on your bathroom mirror, above your desk, or on your kitchen cabinet. Read it once every morning — just 60 seconds. After two weeks the formulas will be in your subconscious. After four weeks they will be automatic.
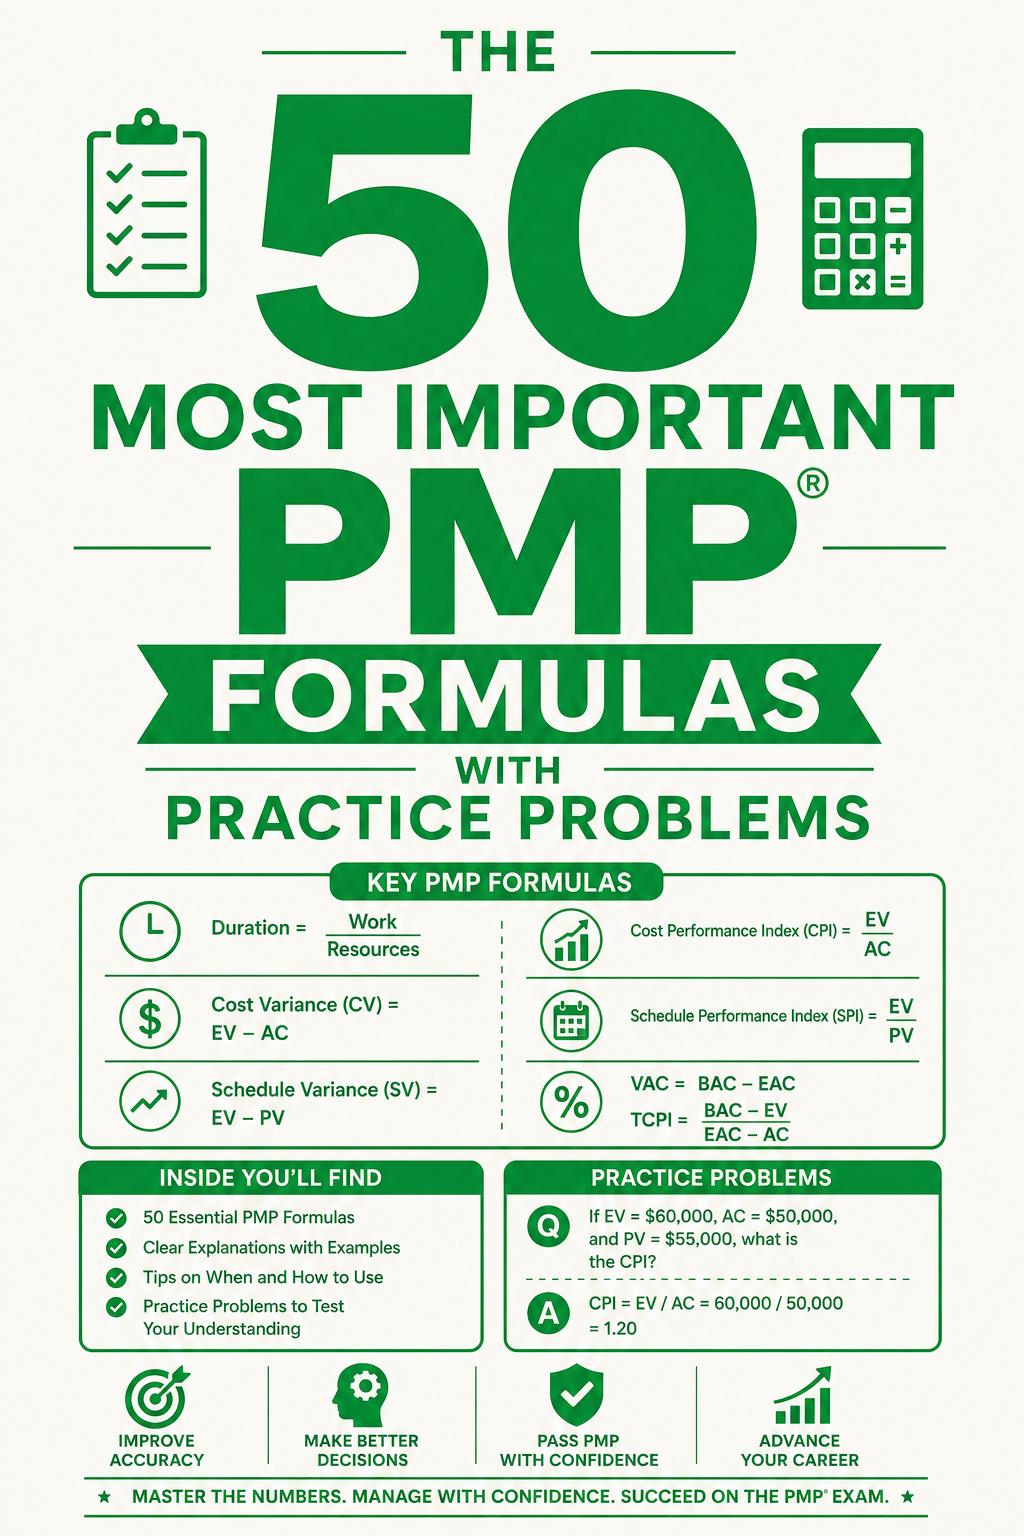
Category 1: Earned Value Management (EVM) Formulas
EVM is the most formula-dense topic on the PMP exam. Master these 12 formulas and you own the entire EVM section.
The Three Foundation Values
| PV = Planned Value Authorised budget for scheduled work — what should have been done by now in dollar terms |
| EV = Earned Value Authorised budget for work actually completed — NOT what it cost, what it was planned to cost |
| AC = Actual Cost What you actually spent to complete the work done so far |
Variance Formulas — Negative is Always Bad
| SV = EV − PV Schedule Variance. Negative = behind schedule. Positive = ahead of schedule. |
| CV = EV − AC Cost Variance. Negative = over budget. Positive = under budget. |
Memory trick: both variances start with EV. SV subtracts PV (the Plan). CV subtracts AC (the Actual cost). If the result is negative, something is worse than planned.
Performance Index Formulas — Less Than 1 is Always Bad
| SPI = EV ÷ PV Schedule Performance Index. Less than 1 = behind schedule. Greater than 1 = ahead. |
| CPI = EV ÷ AC Cost Performance Index. Less than 1 = over budget. Greater than 1 = under budget. |
Forecasting Formulas
| EAC = BAC ÷ CPI Estimate at Completion — if current cost performance continues (most commonly tested) |
| EAC = AC + (BAC − EV) Estimate at Completion — if future work performs at the original planned rate |
| EAC = AC + [(BAC−EV) ÷ (CPI × SPI)] Estimate at Completion — if both cost and schedule performance influence future work |
| ETC = EAC − AC Estimate to Complete — remaining cost to finish the project from this point |
| VAC = BAC − EAC Variance at Completion — how much over or under budget the project will finish |
| TCPI = (BAC−EV) ÷ (BAC−AC) To-Complete Performance Index to meet BAC — efficiency needed for remaining work |
EVM Practice Problem
A project has a BAC of $100,000. After 3 months, PV = $40,000, EV = $35,000, AC = $38,000. Calculate all key EVM metrics:
| Metric | Formula | Calculation | Answer | Meaning |
| SV | EV − PV | 35,000 − 40,000 | −$5,000 | Behind schedule |
| CV | EV − AC | 35,000 − 38,000 | −$3,000 | Over budget |
| SPI | EV ÷ PV | 35,000 ÷ 40,000 | 0.875 | 87.5 cents of work per $1 planned |
| CPI | EV ÷ AC | 35,000 ÷ 38,000 | 0.921 | 92.1 cents of value per $1 spent |
| EAC (BAC÷CPI) | BAC ÷ CPI | 100,000 ÷ 0.921 | $108,578 | Projected total cost if trend continues |
| ETC | EAC − AC | 108,578 − 38,000 | $70,578 | Remaining cost to complete |
| VAC | BAC − EAC | 100,000 − 108,578 | −$8,578 | Project will finish $8,578 over budget |
Category 2: Critical Path Method (CPM) Formulas
CPM involves both calculation and interpretation. The formulas are simple — the challenge is applying them correctly to network diagrams under time pressure.
| Float = Late Start − Early Start Also = Late Finish − Early Finish. Zero float = on the critical path. |
| Free Float = ES of successor − EF of activity Float available without delaying the next task specifically |
| Critical Path = Longest path through the network The sequence of activities that determines the minimum project duration |
CPM Practice Problem
A project has three paths: Path A-B-D = 5+8+7 = 20 days. Path A-C-E = 5+6+9 = 20 days. Path A-B-E = 5+8+9 = 22 days.
- Critical Path: A-B-E (22 days — the longest path)
- Float on Path A-B-D: 22 − 20 = 2 days
- Float on Path A-C-E: 22 − 20 = 2 days
- Float on Activity B: 0 — it is on the critical path A-B-E
Category 3: Communications Formula
| Channels = n × (n−1) ÷ 2 Where n = number of stakeholders or team members |
| Team Size | Channels | Increase from Previous |
| 5 people | 10 channels | — |
| 10 people | 45 channels | +35 channels for 5 new people |
| 15 people | 105 channels | +60 channels for 5 new people |
| 20 people | 190 channels | +85 channels for 5 more people |
Memory: n times n-minus-one, divide by two. The growth is exponential — adding one person to a 10-person team adds 10 new communication channels. This is why large teams need formal communication structures.
Category 4: Schedule Formulas
| PERT Estimate = (O + 4M + P) ÷ 6 Optimistic + 4 × Most Likely + Pessimistic, divided by 6 |
| Standard Deviation = (P − O) ÷ 6 Pessimistic minus Optimistic, divided by 6 |
| Variance = [(P − O) ÷ 6]² Standard deviation squared |
PERT Practice Problem
An activity has Optimistic = 3 days, Most Likely = 5 days, Pessimistic = 10 days.
- PERT Estimate = (3 + 4×5 + 10) ÷ 6 = (3 + 20 + 10) ÷ 6 = 33 ÷ 6 = 5.5 days
- Standard Deviation = (10 − 3) ÷ 6 = 7 ÷ 6 = 1.17 days
- Variance = 1.17² = 1.37
Category 5: Procurement and Contract Value
| Point of Total Assumption (PTA) = ((Ceiling − Target) ÷ Buyer’s Share) + Target Cost Used in FPIF contracts — the cost above which the seller absorbs all overruns |
PTA is the most complex procurement formula. It only applies to Fixed Price Incentive Fee (FPIF) contracts. On the exam, when you see PTA in a question, it will always be in an FPIF context.
Category 6: Quality Formulas
| Sigma Values: 1σ = 68.27% | 2σ = 95.46% | 3σ = 99.73% | 6σ = 99.9997% Control chart sigma levels — memorise these four values |
The Complete Formula Reference Table
Print this table and stick it on your wall alongside your formula sheet:
| Formula | What It Calculates | Key Rule |
| SV = EV − PV | Schedule variance in dollars | Negative = bad |
| CV = EV − AC | Cost variance in dollars | Negative = bad |
| SPI = EV ÷ PV | Schedule efficiency ratio | Less than 1 = bad |
| CPI = EV ÷ AC | Cost efficiency ratio | Less than 1 = bad |
| EAC = BAC ÷ CPI | Projected total cost (default) | Most commonly tested EAC |
| EAC = AC + (BAC−EV) | Projected total cost (return to plan) | Use when variance is atypical |
| ETC = EAC − AC | Remaining cost to complete | Always positive |
| VAC = BAC − EAC | Final budget variance | Negative = over budget |
| TCPI = (BAC−EV)÷(BAC−AC) | Required future efficiency | Greater than 1 = harder than current |
| Float = LS − ES | Activity scheduling flexibility | Zero = critical path |
| Free Float = ES(succ) − EF | Float without delaying successor | Always ≤ Total Float |
| Channels = n(n−1)÷2 | Communication complexity | Exponential growth with team size |
| PERT = (O+4M+P)÷6 | Weighted duration estimate | Four times the most likely |
| SD = (P−O)÷6 | Estimate uncertainty | Larger range = more uncertainty |
| PTA = ((Ceiling−Target)÷Share)+Target | FPIF cost threshold | Seller absorbs costs above this |
Memory Tricks That Actually Work
Beyond the formula wall technique, here are the specific memory anchors that help with the most confusing formulas:
- SV and CV both start with EV: think EV Minus P for schedule (EV − PV), EV Minus A for cost (EV − AC)
- SPI and CPI both divide into EV: EV divided by P for schedule (EV÷PV), EV divided by A for cost (EV÷AC)
- Negative variances are always bad. Think of it like your bank account — negative means you owe something.
- Performance indices below 1.0 are always bad. Below 1.0 means you are getting less than a dollar’s worth for every dollar — whether time or money.
- PERT: O plus 4M plus P — the M gets four times the weight because it is the most likely outcome.
- Communications channels: n times n-minus-1, cut in half. Think of handshakes — everyone shakes hands once with everyone else.
About the Author
Rahul Dhakate is a PMP and PSM I certified project manager and product management leader based in Nagpur, India, with 20 years of experience managing software projects across BFSI, eCommerce, and enterprise software. He used the formula wall technique extensively during PMP preparation — writing all key formulas on paper and reviewing them each morning — finding that daily repetition built automatic recall far more effectively than focused drilling sessions. He writes at LearnXYZ.in to help working professionals pass the PMP exam and build modern project management careers.
Next Article If You Are New To The Site: Start Your PMP Journey Here