By Rahul Dhakate · PMP Certified · May 2026 · learnxyz.in
Earned Value Management — EVM — is one of the most feared topics on the PMP exam. Candidates look at the formulas, see abbreviations like CPI, SPI, EAC, TCPI, and immediately feel overwhelmed. The calculations appear complex and the connections between formulas are not obvious until someone explains them the right way.
I want to do that here. Not with a list of formulas to memorise, but with a clear explanation of what EVM actually is, what each formula is actually measuring, and how to use that understanding to answer exam questions correctly — even when the numbers are unfamiliar.
From my own project experience: we tracked planned versus actual budget across multiple software projects, studying how actual costs accrued over time compared to what we had forecast. We could never predict with 100% accuracy — but maintaining 90 to 95% accuracy in our cost forecasts was a realistic and consistently achievable target. EVM gives you the formal framework for doing exactly this kind of tracking and forecasting.
Table of Contents
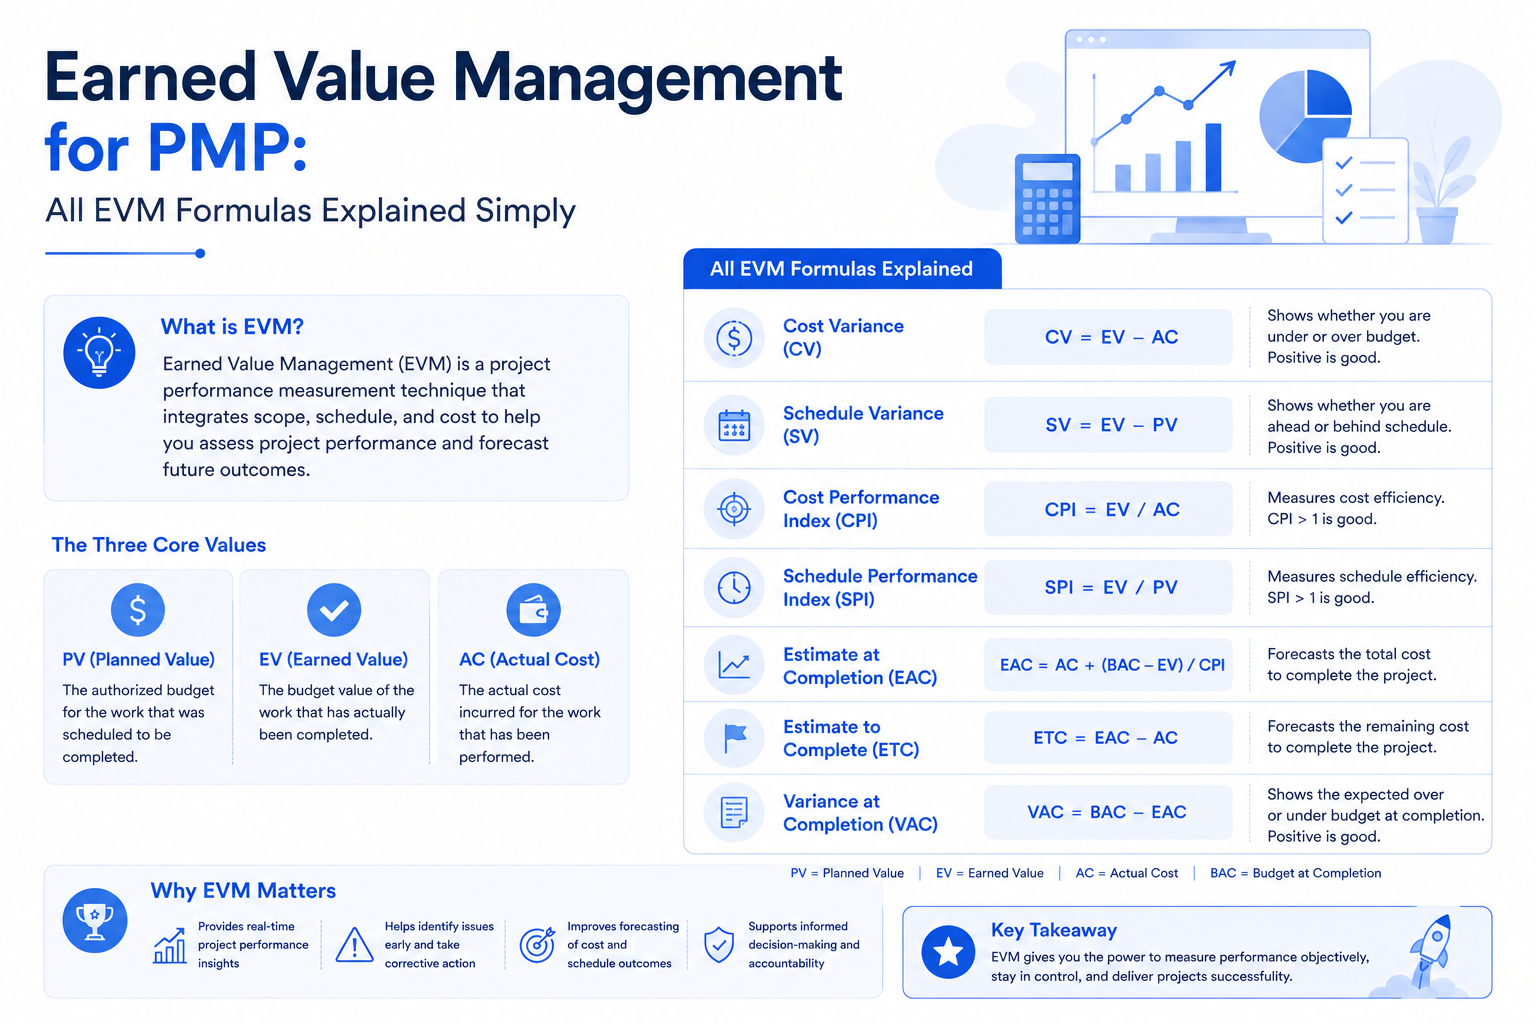
Earned Value Management for PMP: All EVM Formulas Explained Simply
What is Earned Value Management?
Variance Metrics — How Far Off Are We?
Performance Index Metrics — How Efficiently Are We Working?
Forecasting Metrics — Where Will We End Up?
EAC Formula 1 — If future work performs at the original planned rate
EAC Formula 2 — If future work continues at current CPI
EAC Formula 3 — If both CPI and SPI influence future performance
Estimate to Complete (ETC) — How much more will it cost?
TCPI — The Most Misunderstood EVM Formula
The Complete EVM Formula Cheat Sheet
How to Approach EVM Questions on the Exam
What is Earned Value Management?
EVM is a project performance measurement technique that integrates three dimensions of project status into a single framework:
- Scope: How much work was planned, and how much has actually been completed?
- Schedule: Are we ahead of or behind where we planned to be at this point in time?
- Cost: Are we spending more or less than planned for the work completed so far?
Traditional project reporting answers only one or two of these questions at a time. You might know your budget variance or your schedule variance separately, but EVM connects them — giving you a complete picture of project health with a small set of integrated metrics.
The Three Foundation Values
Everything in EVM is built on three core values. Understand these three and the formulas become logical rather than arbitrary.
| PV — Planned Value The authorised budget assigned to scheduled work. What should have been done by now, in dollar terms. |
| EV — Earned Value The authorised budget for work actually completed. What has been done, measured in planned cost terms — not actual cost. |
| AC — Actual Cost The actual cost incurred for work completed. What you actually spent to do the work that has been done. |
The most important insight in EVM: Earned Value (EV) is always measured in budget terms, not in actual cost terms. EV tells you how much of your budget you have ‘earned’ by completing work — regardless of what that work actually cost you. This is what makes EVM powerful.
A simple example to anchor this: your project has a total budget of $100,000 for 10 equal tasks. Each task is therefore worth $10,000 in planned value. After one month, you planned to complete 4 tasks (PV = $40,000). You actually completed 3 tasks (EV = $30,000). To complete those 3 tasks you spent $35,000 (AC = $35,000). Now every EVM metric can be calculated from these three numbers.
Variance Metrics — How Far Off Are We?
| Schedule Variance (SV) = EV − PV Negative SV = behind schedule. Positive SV = ahead of schedule. SV = 0 means on schedule. |
| Cost Variance (CV) = EV − AC Negative CV = over budget. Positive CV = under budget. CV = 0 means on budget. |
Using our example: SV = $30,000 − $40,000 = −$10,000 (behind schedule). CV = $30,000 − $35,000 = −$5,000 (over budget).
Memory trick: both variances use EV as the starting point and subtract the other value. SV subtracts PV (the plan). CV subtracts AC (the actual spend). If the result is negative, something is worse than planned.
Performance Index Metrics — How Efficiently Are We Working?
Variance metrics tell you the absolute difference. Performance indices tell you the ratio — how efficiently you are using time and money relative to plan.
| Schedule Performance Index (SPI) = EV ÷ PV SPI < 1 = behind schedule. SPI > 1 = ahead of schedule. SPI = 1 means exactly on schedule. |
| Cost Performance Index (CPI) = EV ÷ AC CPI < 1 = over budget (getting less than $1 of value per $1 spent). CPI > 1 = under budget. CPI = 1 means on budget. |
From our example: SPI = $30,000 ÷ $40,000 = 0.75 (for every dollar of work we planned to have done, we have completed 75 cents worth). CPI = $30,000 ÷ $35,000 = 0.857 (for every dollar we spend, we are delivering 85.7 cents of planned value).
| Index Value | Schedule (SPI) | Cost (CPI) |
| = 1.0 | Exactly on schedule | Exactly on budget |
| < 1.0 | Behind schedule | Over budget (bad) |
| > 1.0 | Ahead of schedule | Under budget (good) |
PMP exam trap: SPI and CPI less than 1 is always bad for cost and schedule. But on the exam, read carefully — sometimes a question will give you an SPI > 1 and ask if you should be concerned. The answer may be yes if the project is ahead of schedule but over budget at the same time.
Forecasting Metrics — Where Will We End Up?
This is where EVM becomes most powerful — and most complex. Forecasting metrics use current performance to predict where the project will end up. There are several versions of Estimate at Completion (EAC), each based on a different assumption about future performance.
First, one more foundational value:
| BAC — Budget at Completion The total authorised budget for the entire project. This is your baseline budget — what the project was originally supposed to cost in total. |
EAC Formula 1 — If future work performs at the original planned rate
| EAC = AC + (BAC − EV) Use when: current variances are considered atypical and future work will return to plan. |
EAC Formula 2 — If future work continues at current CPI
| EAC = BAC ÷ CPI Use when: current cost performance trend is expected to continue for the rest of the project. This is the most commonly tested formula. |
EAC Formula 3 — If both CPI and SPI influence future performance
| EAC = AC + [(BAC − EV) ÷ (CPI × SPI)] Use when: both cost and schedule performance are impacting the estimate to complete. |
For the PMP exam, the most frequently tested EAC formula is EAC = BAC ÷ CPI. When the question does not specify which formula to use, default to this one unless context suggests otherwise.
Estimate to Complete (ETC) — How much more will it cost?
| ETC = EAC − AC The remaining cost to complete the project from this point forward. |
Variance at Completion (VAC) — How far over or under budget will we finish?
| VAC = BAC − EAC Negative VAC = project will finish over budget. Positive VAC = project will finish under budget. |
TCPI — The Most Misunderstood EVM Formula
To-Complete Performance Index (TCPI) measures the cost performance efficiency required from this point forward to meet a specific financial target. It is often the formula candidates struggle with most.
| TCPI (to meet BAC) = (BAC − EV) ÷ (BAC − AC) The cost efficiency needed to complete remaining work within the original budget. |
| TCPI (to meet EAC) = (BAC − EV) ÷ (EAC − AC) The cost efficiency needed to complete remaining work within the revised estimate. |
Interpretation: TCPI > 1 means you need to work more efficiently than you have been. TCPI < 1 means you can afford to be less efficient and still hit the target. TCPI = 1 means current efficiency is exactly right.
If your current CPI is 0.85 and your TCPI to meet BAC is 1.25, that gap tells you something important: achieving the original budget is very unlikely because it requires dramatically improving your cost efficiency for the rest of the project. In such cases, revising the EAC upward and presenting it honestly to stakeholders is the right project management decision.
The Complete EVM Formula Cheat Sheet
| Formula | What It Measures | Good Result |
| SV = EV − PV | Schedule variance in dollars | Positive (or zero) |
| CV = EV − AC | Cost variance in dollars | Positive (or zero) |
| SPI = EV ÷ PV | Schedule efficiency ratio | > 1 or = 1 |
| CPI = EV ÷ AC | Cost efficiency ratio | > 1 or = 1 |
| EAC = BAC ÷ CPI | Forecast total cost (most common) | Close to BAC |
| EAC = AC + (BAC−EV) | Forecast if future returns to plan | Close to BAC |
| ETC = EAC − AC | Remaining cost to complete | As low as possible |
| VAC = BAC − EAC | Variance at completion | Positive (under budget) |
| TCPI = (BAC−EV)÷(BAC−AC) | Efficiency needed to hit BAC | Close to 1.0 |
How to Approach EVM Questions on the Exam
EVM questions on the PMP exam come in two types: calculation questions (give me the CPI given these numbers) and interpretation questions (the CPI is 0.8 — what does this mean?).
For calculation questions: write down PV, EV, AC, and BAC from the question. Then apply the relevant formula. The arithmetic is never complex — single-digit multiplication or division. The challenge is identifying which formula applies.
For interpretation questions: remember the two rules. For variances (SV, CV): negative is bad, positive is good. For indices (SPI, CPI): less than 1 is bad, greater than 1 is good.
Practice EVM with real numbers from a simple scenario — a 10-task project, 5 tasks complete, costs given. Calculate every metric from scratch. Do this five times with different numbers. After five complete worked examples, EVM becomes mechanical. The fear disappears because you understand what each number is actually telling you.
About the Author:

Rahul Dhakate is a PMP-certified project manager and product management leader based in Nagpur, India, with 20 years of experience managing software projects across BFSI, eCommerce, and enterprise software. He tracked planned versus actual costs across multiple software delivery projects, applying EVM principles to maintain 90–95% forecast accuracy on project budgets. He writes at LearnXYZ.in to help working professionals understand both the theory and the real-world practice of project management.
Learn Next:
Upcoming: Risk Register