


Today analytics has become a critical tool for driving efficiency, innovation, and competitiveness. As we approach 2025, the integration of advanced analytics into software development processes is not just a trend but a necessity. Analytics empowers organizations to make data-driven decisions, optimize workflows, and deliver high-quality software products. This article explores the role of analytics in software development, highlighting key trends, tools, and best practices shaping the industry. It also provides a comprehensive checklist of analytics—both generic and software-specific—that companies should consider, offering a forward-looking perspective on analytics in 2025 and beyond.
Understanding Analytics in Software Development
Analytics in software development refers to the use of data, statistical algorithms, and tools to gain insights into various aspects of the software development lifecycle. These insights help organizations improve processes, enhance product quality, and make informed decisions. Analytics can be applied at every stage, from planning and coding to testing, deployment, and maintenance.
Types of Analytics
Analytics can be categorized into four main types, each serving a distinct purpose:
- Descriptive Analytics: Summarizes historical data to provide insights into what has happened. In software development, it tracks project progress, identifies bottlenecks, and evaluates team performance.
- Diagnostic Analytics: Digs deeper to understand why something happened, identifying root causes of issues like bugs or delays.
- Predictive Analytics: Uses historical data and algorithms to forecast future outcomes, such as project completion times or user adoption rates.
- Prescriptive Analytics: Recommends actions based on predictions, suggesting optimizations in code, resources, or processes.
These types of analytics work together to provide a holistic view of the development process, enabling teams to make proactive decisions.
Key Trends in Software Development Analytics for 2025
As we move into 2025, several trends are shaping the role of analytics in software development. These trends reflect the growing importance of data-driven decision-making and the integration of cutting-edge technologies.
AI and Machine Learning Integration
AI-driven analytics are becoming more sophisticated, enabling predictive and prescriptive insights. Tools like GitHub Copilot and Jira Advanced Roadmaps use AI to automate tasks and provide actionable insights, reducing repetitive work and accelerating development.
Real-Time Analytics
With advancements in 5G and edge computing, real-time analytics are becoming more accessible. This allows developers to monitor and respond to changes instantly, improving agility and reducing downtime. For example, real-time analytics can detect performance issues in production environments and trigger immediate fixes.
Sustainability Analytics
As environmental concerns grow, analytics are being used to optimize resource usage and reduce carbon footprints. AI-driven tools can predict energy consumption patterns and optimize server usage, aligning with green computing goals.
Security Analytics
With cybersecurity threats on the rise, analytics play a crucial role in identifying vulnerabilities and ensuring compliance with security standards. Tools that analyze code for potential risks are becoming essential in 2025.
User Behavior Analytics
Understanding how users interact with software is key to improving user experience and driving innovation. Analytics tools that track user engagement and behavior provide valuable insights for iterative development.

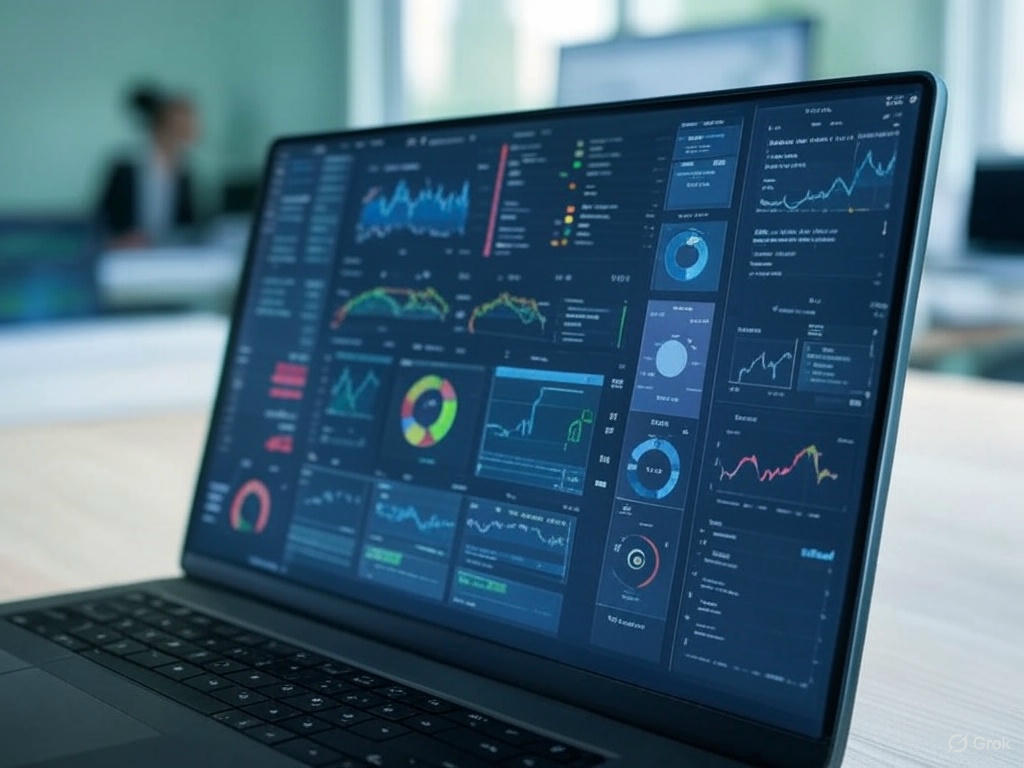
Advanced Data Visualization
As data volumes grow, advanced visualization tools are critical for making complex data understandable. Dashboards and interactive reports help teams quickly grasp key metrics and trends, improving decision-making.
DevOps and CI/CD Analytics
Analytics are increasingly integrated into DevOps practices, providing insights into deployment frequency, mean time to recovery (MTTR), and change failure rates. This helps teams optimize their continuous integration and continuous deployment (CI/CD) pipelines.
Top Software Development Analytics Tools for 2025
Several tools have emerged as leaders in software development analytics, offering comprehensive insights into team performance, code quality, and project management. Here are some of the top tools for 2025:
| Tool | Description | Key Features |
|---|---|---|
| Jellyfish | An Engineering Management Platform for strategic decision-making. | Resource allocation, scenario planning, performance analysis. |
| Axify | Provides visibility into processes and actionable insights. | Bottleneck identification, workflow improvement, real-time analytics. |
| Waydev | A Git Analytics tool for data-driven leadership. | Code quality insights, team performance tracking, executive dashboards. |
| Monday Dev | Centralizes the product lifecycle and syncs collaboration tools. | Cross-team dashboards, real-time updates, task tracking. |
| Pluralsight | Measures team performance and improves software quality. | Bug tracking, performance metrics, development analytics. |
These tools integrate with platforms like GitLab and JIRA, making it easier to collect and analyze data.
Comprehensive Checklist of Analytics for Companies
Analytics can be divided into generic analytics, applicable to all businesses, and software-related analytics, specific to software development. Below is a comprehensive checklist.
Generic Analytics
These analytics help optimize overall business performance:
- Financial Analytics: Analyzes financial data to understand profitability and health.
- Marketing Analytics: Measures campaign effectiveness and customer acquisition.
- Sales Analytics: Tracks performance, forecasts sales, and identifies trends.
- Customer Analytics: Understands behavior, preferences, and satisfaction.
- Operational Analytics: Optimizes operations, supply chain, and logistics.
- HR Analytics: Improves recruitment, retention, and employee performance.
- Risk Analytics: Identifies and mitigates business risks.
Software-Related Analytics
These analytics optimize the development process and product quality:
| Metric | Description |
|---|---|
| Code Quality Analytics | Measures code complexity, duplication, and adherence to standards. |
| Development Velocity | Tracks speed of feature development and deployment. |
| Bug and Issue Tracking | Monitors bug count, severity, and resolution time. |
| Test Coverage | Ensures adequate code testing. |
| Deployment Frequency | Measures how often new versions are deployed. |
| Mean Time To Recovery (MTTR) | Tracks time to resolve issues post-deployment. |
| Change Failure Rate | Percentage of deployments that fail. |
| Lead Time for Changes | Time from code commit to deployment. |
| Cycle Time | Time from starting a feature to completion. |
| Throughput | Number of features completed in a period. |
| Work in Progress (WIP) | Monitors ongoing work volume. |
| Team Utilization | Measures time spent on productive work. |
| Collaboration Metrics | Tracks team collaboration, e.g., pull request reviews. |
| Security Analytics | Identifies vulnerabilities and ensures compliance. |
| Performance Analytics | Monitors application performance, e.g., response times. |
| User Experience Analytics | Gathers feedback on user interactions. |
| Cost Analytics | Tracks development, maintenance, and operational costs. |
| Resource Utilization | Monitors CPU, memory, and other resource usage. |
| Scalability Analytics | Assesses software performance under increased load. |
| Compliance and Governance | Ensures regulatory and policy compliance. |
The Future of Analytics in Software Development (2025 and Beyond)
Looking ahead, analytics will continue to evolve, driven by several factors:
- Increased AI and ML Adoption: AI will enable more accurate predictions and recommendations, automating complex tasks.
- Edge Computing and Real-Time Insights: Real-time analytics will become standard, supporting immediate decision-making.
- Sustainability Focus: Analytics will minimize environmental impact by optimizing energy usage.
- Advanced Security Measures: Proactive threat detection will be critical as systems grow more complex.
- Hyper-Personalization: User behavior analytics will drive personalized software experiences.
- Ethical AI and Data Privacy: Ensuring ethical data use and privacy will be paramount.
By 2025, companies that embrace these trends will lead in innovation, cost-efficiency, and product quality.

What is Holographic Projection?
Holographic projection is a technology that uses light diffraction to create three-dimensional images, making data appear as if it’s physically present. It doesn’t require special glasses, making it accessible for various uses.
How It Applies to Analytics
In analytics, holographic projection can display charts, graphs, and dashboards in 3D, allowing users to interact with data from different angles. This is particularly useful in business for real-time insights and in research for visualizing complex datasets.
Future Outlook for 2025 and Beyond
By 2025, holographic projection is expected to integrate with AI and edge computing, potentially revolutionizing how we analyze data. It may become standard in forward-thinking organizations, enhancing collaboration and innovation.
Comprehensive Analysis on Holographic Projection in Analytics
Holographic projection, a technology that creates three-dimensional (3D) images in space using light diffraction, has evolved from a science fiction concept to a practical tool with significant applications in analytics and software development. As of May 11, 2025, this technology is poised to transform how data is visualized and interacted with, particularly in business, scientific research, and software engineering. This analysis explores what holographic projection is, its applications in analytics, current trends, challenges, and future prospects, especially considering the advancements expected by 2025 and beyond.
Understanding Holographic Projection
Holographic projection works by capturing and reproducing the light scattered from an object to create a 3D image. This is achieved through techniques such as interference patterns or rear-projection onto semi-transparent screens. The technology, first coined by Hungarian/British engineer Dennis Gabor in 1949, has seen rapid advancements, with companies like HYPERVSN and Virtual On leading innovations in digital signage and experiential marketing
. Unlike traditional 2D displays, holographic projections allow users to view data from all sides, creating a realistic and immersive experience without the need for additional equipment like 3D glasses.
Applications in Analytics
In the realm of analytics, holographic projection offers a novel way to visualize data, enhancing both comprehension and interaction. Key applications include:
- Business Analytics: Holographic displays can present real-time dashboards, showing key performance indicators (KPIs) like sales trends or operational efficiency in 3D. For instance, managers can walk around a holographic display to view regional sales data from different angles, improving decision-making .
- Scientific Research: In fields like climate science or astronomy, holographic projections can visualize complex datasets, such as molecular structures or climate models, in 3D. This facilitates better analysis by allowing researchers to identify patterns or anomalies that might be obscured in 2D .
- Software Development: Holographic analytics can monitor project metrics, such as code quality, deployment frequency, or team performance, in a 3D environment. This can enhance collaboration among development teams, providing a shared, interactive space for reviewing data.
The immersive nature of holographic displays allows users to manipulate data directly, such as rotating 3D models or zooming into specific data points, fostering a more engaging and intuitive experience.
Current Trends and Technological Integration
As of 2025, several trends are shaping the integration of holographic projection in analytics:
- AI and Machine Learning: AI-driven tools are expected to analyze data and automatically generate holographic visualizations tailored to user needs, enhancing efficiency .
- Edge Computing: Real-time holographic analytics can be processed at the edge, reducing latency and enabling faster insights, which is crucial for dynamic business environments .
- Sustainability Focus: Future holographic systems might optimize energy usage, aligning with green computing initiatives, which is increasingly important for environmentally conscious organizations.
Companies are already deploying holographic technology for various purposes. For example, Virtual On offers holographic stage projection systems for events and presentations, enhancing audience engagement
Challenges and Limitations
Despite its potential, holographic projection faces several challenges:
- Computational Requirements: Generating high-quality holograms requires significant processing power, though advancements in AI and edge computing are addressing this .
- Scalability: Current holographic displays are often limited in size and resolution, which may restrict their use in large-scale analytics environments. Ongoing research is expected to improve these aspects .
- Cost: High-quality holographic systems can be expensive, potentially limiting adoption by smaller organizations. However, costs are anticipated to decrease as the technology matures .
These challenges highlight the need for continued innovation to make holographic analytics more accessible and practical.
Future Prospects for 2025 and Beyond
Looking ahead, holographic projection in analytics is expected to become a standard in forward-thinking organizations by 2025 and beyond. The integration with AI and edge computing will likely enable more sophisticated and real-time data visualizations, enhancing decision-making and collaboration. For instance, holographic dashboards could become common in corporate boardrooms, providing executives with immersive insights into business performance.
In software development, holographic analytics could revolutionize how teams monitor and optimize development processes, potentially integrating with DevOps tools to provide 3D visualizations of deployment metrics or code quality. This could lead to improved efficiency and innovation, as teams can interact with data in new ways.
Moreover, the focus on sustainability will drive the development of energy-efficient holographic systems, aligning with global efforts to reduce carbon footprints. As the technology becomes more affordable and scalable, it is likely to see widespread adoption across industries, transforming how data is analyzed and utilized.
Comparative Analysis: Traditional vs. Holographic Analytics
To illustrate the potential impact, consider the following comparison:
| Aspect | Traditional Analytics (2D) | Holographic Analytics (3D) |
|---|---|---|
| Visualization | Flat charts and graphs on screens | 3D projections, viewable from multiple angles |
| Interactivity | Limited to mouse/keyboard interactions | Direct manipulation, such as rotating or zooming |
| Collaboration | Screen sharing or multiple monitors | Shared 3D space for team interaction |
| Immersion | Limited, 2D perspective | High, immersive 3D experience |
| Use Cases | Reports, dashboards, basic data analysis | Complex data visualization, scientific research |
| Cost and Scalability | Generally lower cost, widely available | Higher initial cost, scalability improving |
This table highlights the advantages of holographic analytics, particularly in scenarios requiring deep data exploration and team collaboration.
Conclusion
Analytics is a fundamental driver of success in software development. By leveraging advanced tools and techniques, organizations can gain deeper insights, make better decisions, and deliver superior software products. As we move into 2025 and beyond, the future of software development is data-driven, and companies that prioritize analytics will stay ahead of the curve.
Also, Holographic projection offers a transformative approach to analytics and software development, providing immersive, interactive, and collaborative data visualization. As of May 11, 2025, it is poised to integrate with AI, edge computing, and sustainability initiatives, potentially becoming a standard in forward-thinking organizations. While challenges like cost and scalability remain, ongoing advancements suggest a bright future for holographic analytics, enhancing how we understand and utilize data in business, science, and beyond.
Read Further