

In project management, data-driven decision-making is crucial to achieving project success. A Pareto chart is an invaluable tool used in the Project Management Professional (PMP) framework for identifying and prioritizing problems, ensuring that efforts are focused on the most critical issues. Based on the Pareto Principle—commonly referred to as the 80/20 rule—this chart is a graphical representation that helps teams visualize the vital few factors contributing to the majority of problems or outcomes.
The Pareto chart combines both bar and line graphs to showcase the frequency of issues and their cumulative impact. It enables project managers to allocate resources more effectively and solve problems that significantly affect the overall project objectives.
When preparing for the PMP certification or managing real-world projects, understanding the importance and application of Pareto charts can be a game-changer. It aids in effective problem-solving, quality control, and continuous improvement, which are integral to project success. Whether you are conducting a root cause analysis, identifying process inefficiencies, or working towards quality improvement, Pareto charts will empower your team to make informed decisions that lead to better results.
In this article, we’ll explore the practical application of Pareto charts in PMP, their significance, exclusive facts, frequently asked questions, and how they fit into the broader PMP framework. By the end, you’ll not only gain a deep understanding of Pareto charts but also have actionable insights for using them effectively in your project management endeavour’s.
Contents
Creating a Pareto Chart in Python.
Top 10 Exclusive Facts About Pareto Charts in PMP.
Top 30 FAQs About Pareto Charts in PMP.
What is a Pareto Chart?
A Pareto chart is a graphical tool used to prioritize issues, defects, or opportunities in descending order of significance. It leverages the Pareto Principle, which states that roughly 80% of effects come from 20% of causes. This visualization helps project managers identify and address the most impactful issues first.
The chart is divided into two key elements:
- Bars: Represent the frequency or magnitude of individual causes.
- Cumulative Line: Depicts the cumulative percentage of the total.
Creating a Pareto Chart in Python
We can easily create a pareto chart in python. Here is the code and details of it.
import pandas as pd
import matplotlib.pyplot as plt

# Data for the Pareto Chart (Realistic example for a software development project)
data = {
    "Issue": [
        "Code Bugs",
        "Requirement Changes",
        "Integration Errors",
        "Deployment Delays",
        "Documentation Gaps",
        "UI/UX Issues",
        "Performance Bottlenecks",
    ],
    "Frequency": [50, 30, 20, 15, 10, 8, 7],
}

# Create a DataFrame
df = pd.DataFrame(data)

# Sort data by frequency in descending order
df = df.sort_values(by="Frequency", ascending=False)

# Calculate cumulative percentage
df["Cumulative Percentage"] = df["Frequency"].cumsum() / df["Frequency"].sum() * 100

# Create the Pareto Chart
fig, ax = plt.subplots(figsize=(10, 6))
ax.bar(df["Issue"], df["Frequency"], color="skyblue", label="Frequency")
ax.set_ylabel("Frequency")
ax.set_title("Pareto Chart for Software Development Project Issues")

# Add the cumulative line
ax2 = ax.twinx()
ax2.plot(df["Issue"], df["Cumulative Percentage"], color="red", marker="o", label="Cumulative Percentage")
ax2.set_ylabel("Cumulative Percentage (%)")
ax2.axhline(80, color="green", linestyle="--", label="80% Threshold")

# Add legend
ax.legend(loc="upper left")
ax2.legend(loc="upper right")

# Adjust the layout and display the chart
plt.xticks(rotation=45)
plt.tight_layout()
plt.show()

# Display the data table used to create the chart
df
# Issue Frequency Cumulative Percentage
0 Code Bugs 50 35.714286
1 Requirement Changes 30 57.142857
2 Integration Errors 20 71.428571
3 Deployment Delays 15 82.142857
4 Documentation Gaps 10 89.285714
5 UI/UX Issues 8 95.000000
6 Performance Bottlenecks 7 100.000000
Here is the Pareto chart for a software development project along with the data used to create it:
Parameters Used for the Chart
| Issue | Frequency | Cumulative Percentage |
| Code Bugs | 50 | 35.71% |
| Requirement Changes | 30 | 57.14% |
| Integration Errors | 20 | 71.43% |
| Deployment Delays | 15 | 82.14% |
| Documentation Gaps | 10 | 89.29% |
| UI/UX Issues | 8 | 95.00% |
| Performance Bottlenecks | 7 | 100.00% |
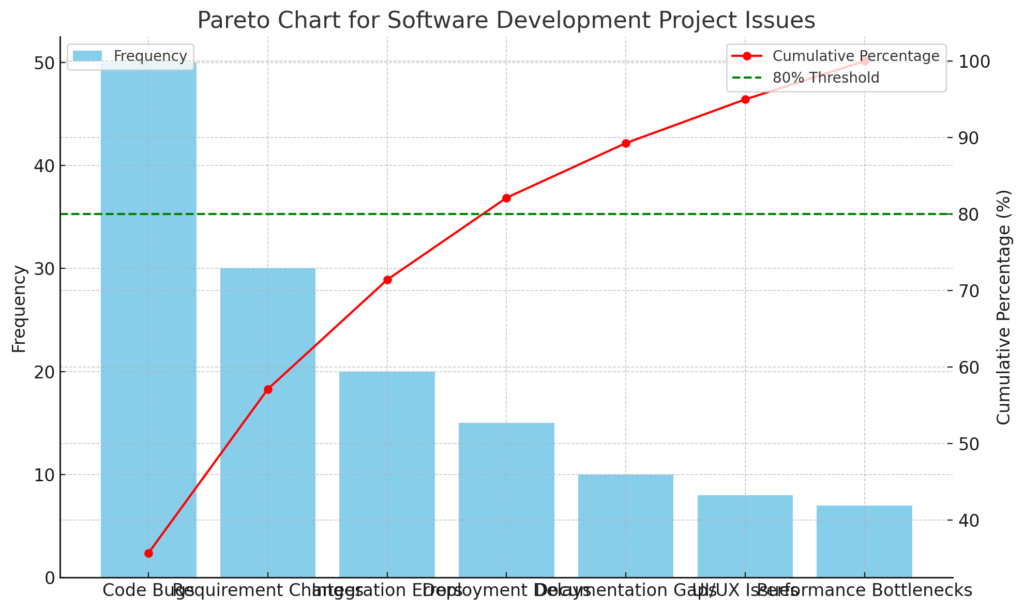
Chart Highlights
- The bars represent the frequency of issues, with “Code Bugs” being the most frequent problem.
- The red line indicates the cumulative percentage of issues.
- The green dashed line marks the 80% threshold, showing that “Code Bugs,” “Requirement Changes,” and “Integration Errors” collectively account for most of the problems.
Calculating values in Excel
Creating a Pareto chart in Excel involves organizing your data and applying simple formulas for frequency and cumulative percentage. Below is a step-by-step guide to calculate and create a Pareto chart in Excel:
Steps to Calculate Pareto Chart Values in Excel
1. Organize Your Data
- Prepare a table with two columns:
- Issue (Category): List the different issues or causes.
- Frequency: Record the frequency or occurrence count for each issue.
2. Sort the Data
- Sort the data in descending order by Frequency so the most significant issue appears first.
3. Calculate Cumulative Frequency
- In a new column, calculate the running total (cumulative frequency) of the sorted frequencies.
- Formula (if data starts in Row 2):rubyCopyEdit
=SUM($B$2:B2)Drag the formula down for all rows.
4. Calculate Cumulative Percentage
- In another column, calculate the cumulative percentage using the formula:mathematicaCopyEdit
=Cumulative Frequency / Total Frequency- Example (if
C2is the cumulative frequency and the total frequency is inB8):swiftCopyEdit=C2/$B$8
- Example (if
5. Create the Pareto Chart
- Highlight the Issue and Frequency columns and insert a Clustered Column Chart.
- Add the Cumulative Percentage column as a secondary axis by:
- Selecting the chart, right-clicking on the data series for cumulative percentage, and selecting “Format Data Series.”
- Check the box for Secondary Axis.
6. Adjust and Finalize
- Add data labels for better visualization.
- Insert a horizontal line at 80% (if applicable) to highlight the Pareto threshold.
- Customize the chart title, legend, and axis labels.
Excel Formulas Recap
| Step | Formula Example (Assume Data Starts at Row 2) |
|---|---|
| Cumulative Frequency | =SUM($B$2:B2) |
| Cumulative Percentage | =C2/$B$8 (Total in $B$8) |
Here is a visually accurate Pareto chart illustrating issues in a software development project. It adheres to the 80/20 rule and marks the most critical issues with an 80% threshold. Let me know if you need further adjustments or insights!
Top 10 Exclusive Facts About Pareto Charts in PMP
- Origin of the Pareto Principle: Named after economist Vilfredo Pareto, the principle was initially applied to wealth distribution, but its versatility extends to project management.
- Dual Purpose: Pareto charts identify key problem areas and measure the success of corrective actions.
- Versatile Applications: While primarily used for quality control, Pareto charts are also applicable in risk management, cost analysis, and resource allocation.
- Key PMP Tool: Pareto charts are a fundamental part of the “Manage Quality” and “Control Quality” processes in PMP.
- Data-Driven Decisions: They ensure decisions are based on data, reducing guesswork.
- Root Cause Analysis: Pareto charts are instrumental in Six Sigma methodologies, often integrated into PMP frameworks.
- Time-Saving: By focusing on the vital few issues, teams can resolve problems faster.
- Customizable Metrics: Metrics such as cost, time, or frequency can be tailored to fit specific project needs.
- Cultural Significance: They promote a culture of continuous improvement within project teams.
- Automation Ready: Many project management tools, like Excel, Tableau, and Jira, support Pareto chart creation, simplifying their use in projects.
Top 30 FAQs About Pareto Charts in PMP
- What is a Pareto chart in PMP?
A Pareto chart is a graphical tool used to identify and prioritize the most significant factors in a project, aiding in problem-solving and quality management.
- Why is the Pareto chart important in PMP?
It helps project managers focus on the vital few causes that contribute to the majority of problems, optimizing resource allocation.
- How does a Pareto chart work?
It combines bar and line graphs to show the frequency of causes and their cumulative impact, making it easy to identify key issues.
- Where is the Pareto chart used in PMP processes?
Pareto charts are used in “Manage Quality” and “Control Quality” processes.
- What is the 80/20 rule in Pareto charts?
It states that 80% of effects come from 20% of causes, emphasizing the importance of addressing the vital few.
- How do I create a Pareto chart in PMP?
Gather data, categorize causes, sort them by frequency, calculate cumulative percentages, and plot the chart.
- Can Pareto charts be used for risk management in PMP?
Yes, they help prioritize risks by identifying the most significant ones impacting the project.
- What tools are used to create Pareto charts?
Tools like Microsoft Excel, Minitab, Tableau, and project management software like Jira support Pareto chart creation.
- Are Pareto charts applicable to Agile projects?
Yes, they can be used in Agile projects to identify and prioritize defects or process inefficiencies.
- What industries benefit most from Pareto charts?
Industries like manufacturing, IT, healthcare, and construction benefit from Pareto charts in quality and process management.
- What are the limitations of Pareto charts?
They do not show causal relationships and may oversimplify complex issues.
- How do Pareto charts support quality control?
By identifying the most frequent defects or problems, teams can focus on eliminating the root causes.
- Can Pareto charts be used for cost analysis?
Yes, they help identify areas where the majority of costs are incurred.
- What data is required for a Pareto chart?
Frequency, cost, or time data related to specific categories or issues.
- How do Pareto charts align with Six Sigma?
They are used in the “Define” and “Analyze” phases to identify key issues affecting quality.
- Can Pareto charts be automated?
Yes, many tools allow for automation, making it easier to generate and update the charts.
- What is the cumulative line in a Pareto chart?
It represents the cumulative percentage of the total impact, helping visualize how issues add up.
- How do Pareto charts improve decision-making?
They provide a clear visual representation of priorities, enabling data-driven decisions.
- What are some alternatives to Pareto charts?
Alternatives include scatter plots, fishbone diagrams, and histograms, depending on the analysis needed.
- Are Pareto charts effective for small projects?
Yes, they are equally effective for small and large projects, as they help focus on key areas.
- What software is best for creating Pareto charts?
Microsoft Excel, Tableau, and Minitab are widely used for creating Pareto charts.
- Can Pareto charts be combined with other PMP tools?
Yes, they can complement tools like root cause analysis and cause-and-effect diagrams.
- How do I interpret a Pareto chart?
Look for the tallest bars and the point where the cumulative line levels off to identify the most critical factors.
- What skills are needed to create Pareto charts?
Basic data analysis and familiarity with graphing tools are sufficient.
- What is the difference between a Pareto chart and a bar chart?
A Pareto chart includes a cumulative line to show the aggregate impact of factors, while a bar chart only displays individual values.
- Can Pareto charts help with time management in projects?
Yes, by identifying tasks or delays that cause the most significant impact on schedules.
- How frequently should Pareto charts be updated in a project?
Update them periodically as new data becomes available or as issues are resolved.
- What are the common pitfalls when using Pareto charts?
Using incomplete data or misinterpreting the chart can lead to incorrect conclusions.
- Do PMP exams include questions on Pareto charts? Yes, they are covered as part of quality management tools in the PMP exam syllabus.
- How do Pareto charts promote continuous improvement?
By highlighting recurring issues, teams can work on long-term solutions, fostering a culture of continuous improvement.
Conclusion
Pareto charts are a cornerstone of effective project management within the PMP framework. By focusing on the vital few causes that significantly impact project outcomes, they enable project managers to allocate resources efficiently and address key issues promptly. The use of Pareto charts simplifies complex problems, ensuring that teams concentrate on the areas that truly matter.
In today’s fast-paced project environments, where time, cost, and quality are critical constraints, Pareto charts provide clarity amidst chaos. They are not just a tool for problem-solving but a strategic asset for ensuring quality and driving continuous improvement. Whether it’s analyzing defects in a manufacturing process, prioritizing risks in a construction project, or managing costs in IT development, Pareto charts are versatile and impactful.
For PMP aspirants, mastering Pareto charts is essential, as they are a frequently tested concept in the certification exam. Beyond the exam, their application in real-world projects highlights their enduring relevance. Modern project management tools make it easier than ever to create and analyze Pareto charts, further increasing their accessibility and utility.
Ultimately, the power of Pareto charts lies in their simplicity and effectiveness. By adopting this tool, project managers can foster a data-driven culture, enhance decision-making, and achieve project success. As you integrate Pareto charts into your project management practices, remember the broader goal: to solve problems that add the most value to your projects and stakeholders.
Good Reads For PMP aspirants