Different Types of Dashboards for PMO and Management in Software Development Organizations
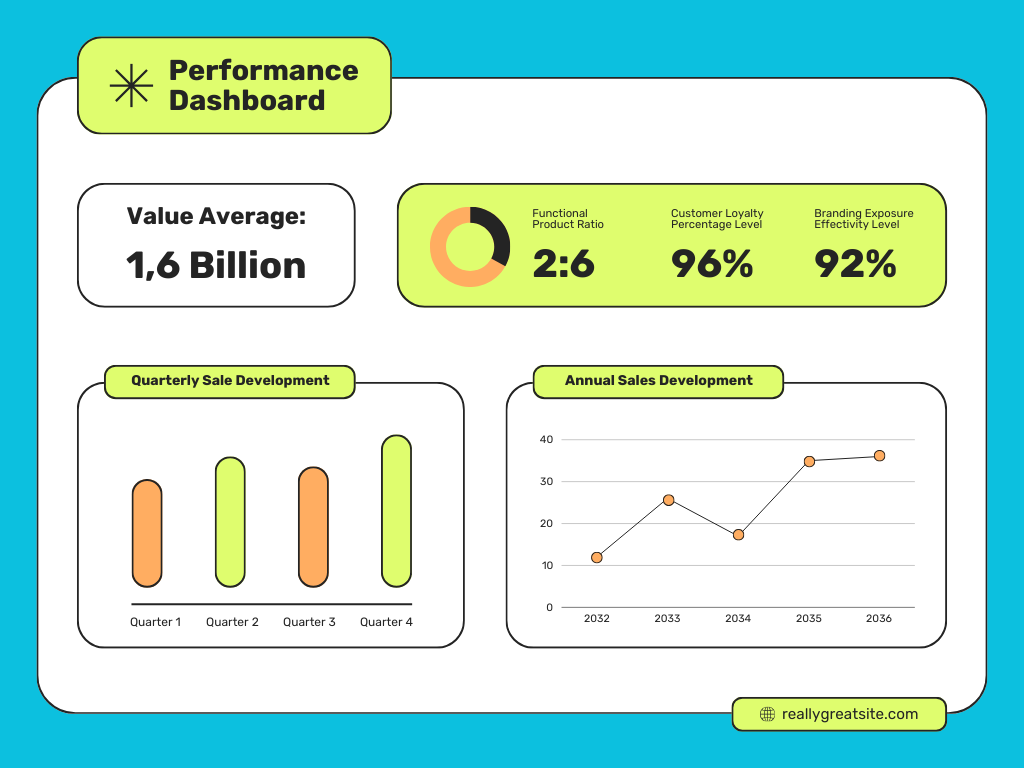
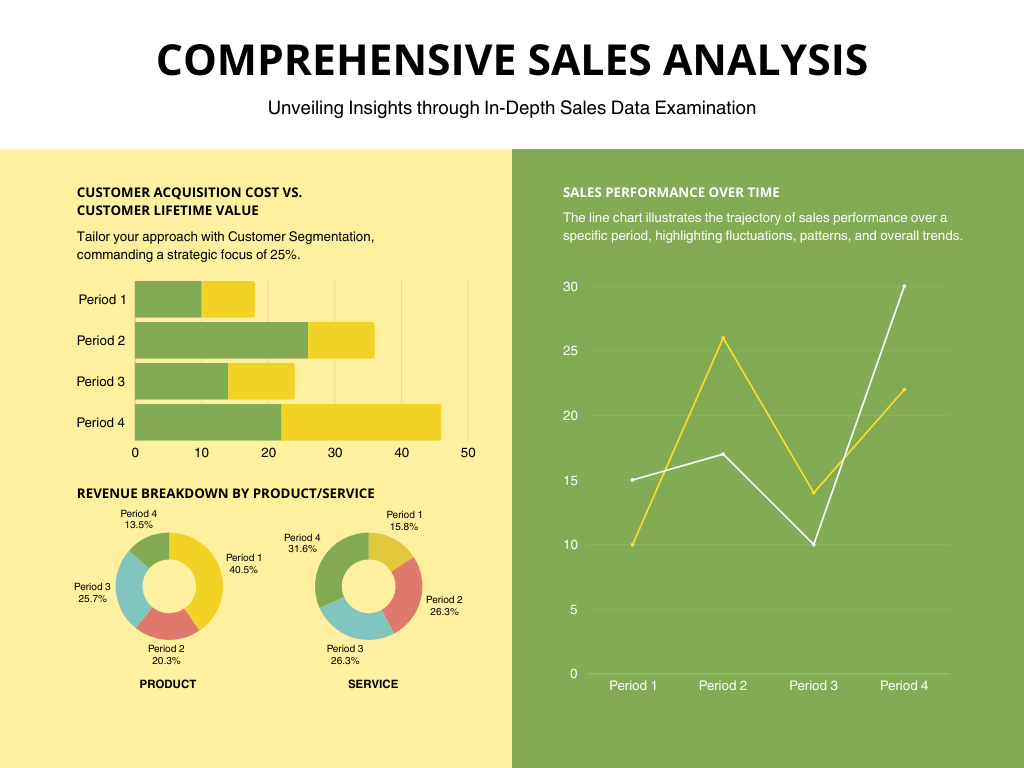
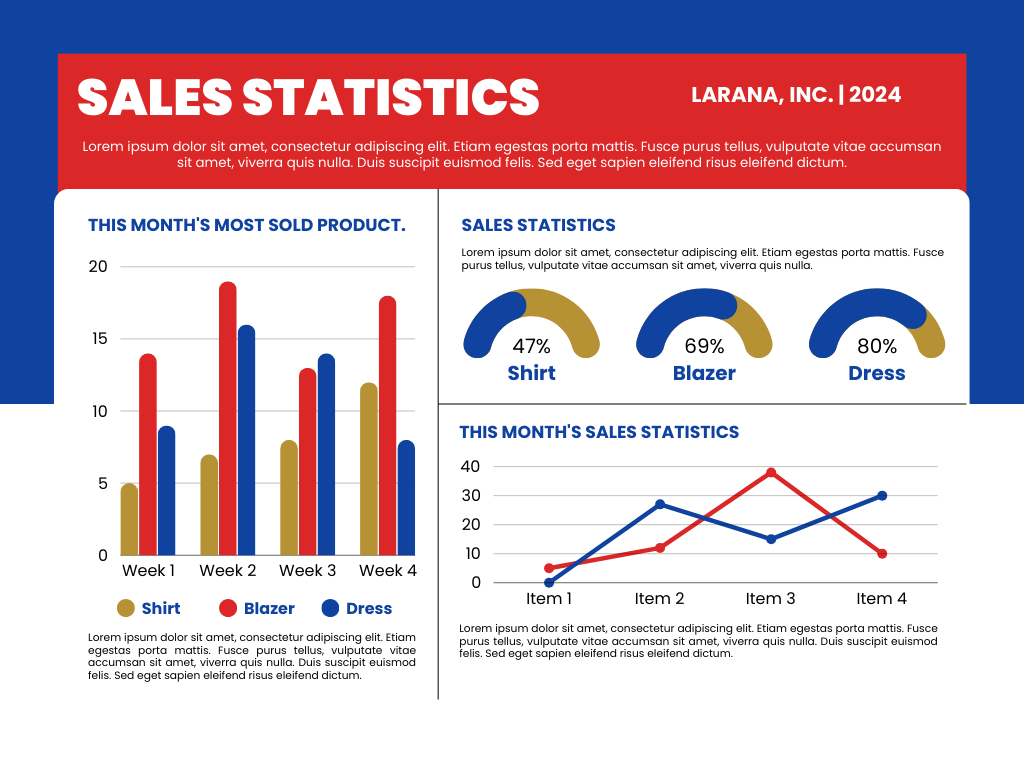
Dashboards have become and ever more essential asset for managers and management alike. They are informative, convenient and trendy these days. In the dynamic world of software development, effective project and management oversight is crucial for delivering successful outcomes. Dashboards play a pivotal role in this process, providing a centralized view of critical metrics, performance indicators, and project statuses. A well-designed dashboard can enhance decision-making, streamline communication, and ensure alignment with organizational goals. For Project Management Offices (PMOs) / PMO Dashboards and management teams, dashboards are indispensable tools that offer real-time insights and help in navigating the complexities of software development projects.
Dashboards can be customized to serve various purposes, from tracking project progress to assessing resource allocation and identifying potential risks. They consolidate data from multiple sources into a coherent and interactive format, making it easier for stakeholders to monitor and analyze project performance. The effectiveness of a dashboard depends on its ability to present relevant information clearly and intuitively.
In this article, we will explore the different types of dashboards that can be created for PMO and management in software development organizations. We will delve into their features, benefits, and best practices for implementation. By understanding the various dashboard types, organizations can select the ones that best align with their needs, enhance their project management capabilities, and drive better outcomes.
1. Project Management Dashboards
Overview
Project Management Dashboards are designed to provide a comprehensive view of project statuses, milestones, and performance metrics. They are essential for PMOs to track the progress of individual projects and ensure they are on schedule and within budget.
Key Features
- Progress Tracking: Visual representations of project timelines, Gantt charts, and milestone tracking help in monitoring the progress against planned schedules.
- Resource Allocation: Displays the allocation of resources across various projects, helping to identify overutilized or underutilized resources.
- Risk Management: Highlights potential risks and issues that could impact project timelines or deliverables.

Benefits
- Enhanced Visibility: Offers a clear view of project progress and resource usage, enabling proactive management.
- Improved Decision-Making: Provides real-time data to make informed decisions about project adjustments and resource reallocation.
- Efficient Communication: Facilitates communication among team members and stakeholders by providing a unified view of project status.
Best Practices
- Customize Metrics: Tailor the dashboard metrics to align with project goals and KPIs.
- Regular Updates: Ensure the dashboard is updated regularly to reflect the latest project data.
- User-Friendly Design: Design the dashboard with intuitive navigation and clear visualizations.
For more on effective project management dashboards, check out this resource.
2. Executive Dashboards
Overview
Executive Dashboards are designed for high-level management and executives. They provide a snapshot of organizational performance and strategic objectives.
Key Features
- KPI Tracking: Displays key performance indicators (KPIs) relevant to strategic goals, such as revenue growth, customer satisfaction, and operational efficiency.
- Performance Metrics: Includes metrics related to project portfolio performance, resource utilization, and financials.
- Trend Analysis: Offers insights into trends and patterns that can influence strategic decisions.
Benefits
- Strategic Oversight: Provides executives with a high-level view of organizational performance and alignment with strategic goals.
- Informed Decision-Making: Helps executives make data-driven decisions by presenting critical information in a digestible format.
- Quick Access: Offers a consolidated view of key metrics and performance indicators, reducing the time spent on data retrieval and analysis.

Best Practices
- Focus on Key Metrics: Prioritize the most critical KPIs that align with strategic objectives.
- Ensure Data Accuracy: Validate the accuracy of data to maintain trust in the dashboard’s insights.
- Visual Appeal: Use clean and visually appealing designs to present data effectively.
Learn more about executive dashboards here.
3. Operational Dashboards
Overview
Operational Dashboards are used for daily operations and monitoring of ongoing activities. They focus on real-time data and operational metrics.
Key Features
- Real-Time Monitoring: Provides up-to-date information on operational metrics, such as system performance, issue resolution times, and service levels.
- Alerts and Notifications: Includes automated alerts for anomalies or deviations from standard operating procedures.
- Performance Indicators: Displays operational metrics related to productivity, efficiency, and quality.
Benefits
- Immediate Insights: Offers real-time visibility into operational performance, allowing for quick response to issues.
- Enhanced Efficiency: Helps identify and address operational inefficiencies promptly.
- Proactive Management: Enables proactive management by highlighting potential issues before they escalate.
Best Practices
- Real-Time Data Integration: Ensure the dashboard integrates with real-time data sources for accurate monitoring.
- Customizable Alerts: Configure alerts based on specific operational thresholds and metrics.
- User Training: Train users to interpret dashboard data effectively and respond to alerts.
4. Financial Dashboards
Overview
Financial Dashboards are focused on tracking and analyzing financial performance. They are essential for financial managers and executives to monitor budgets, expenditures, and financial health.
Key Features
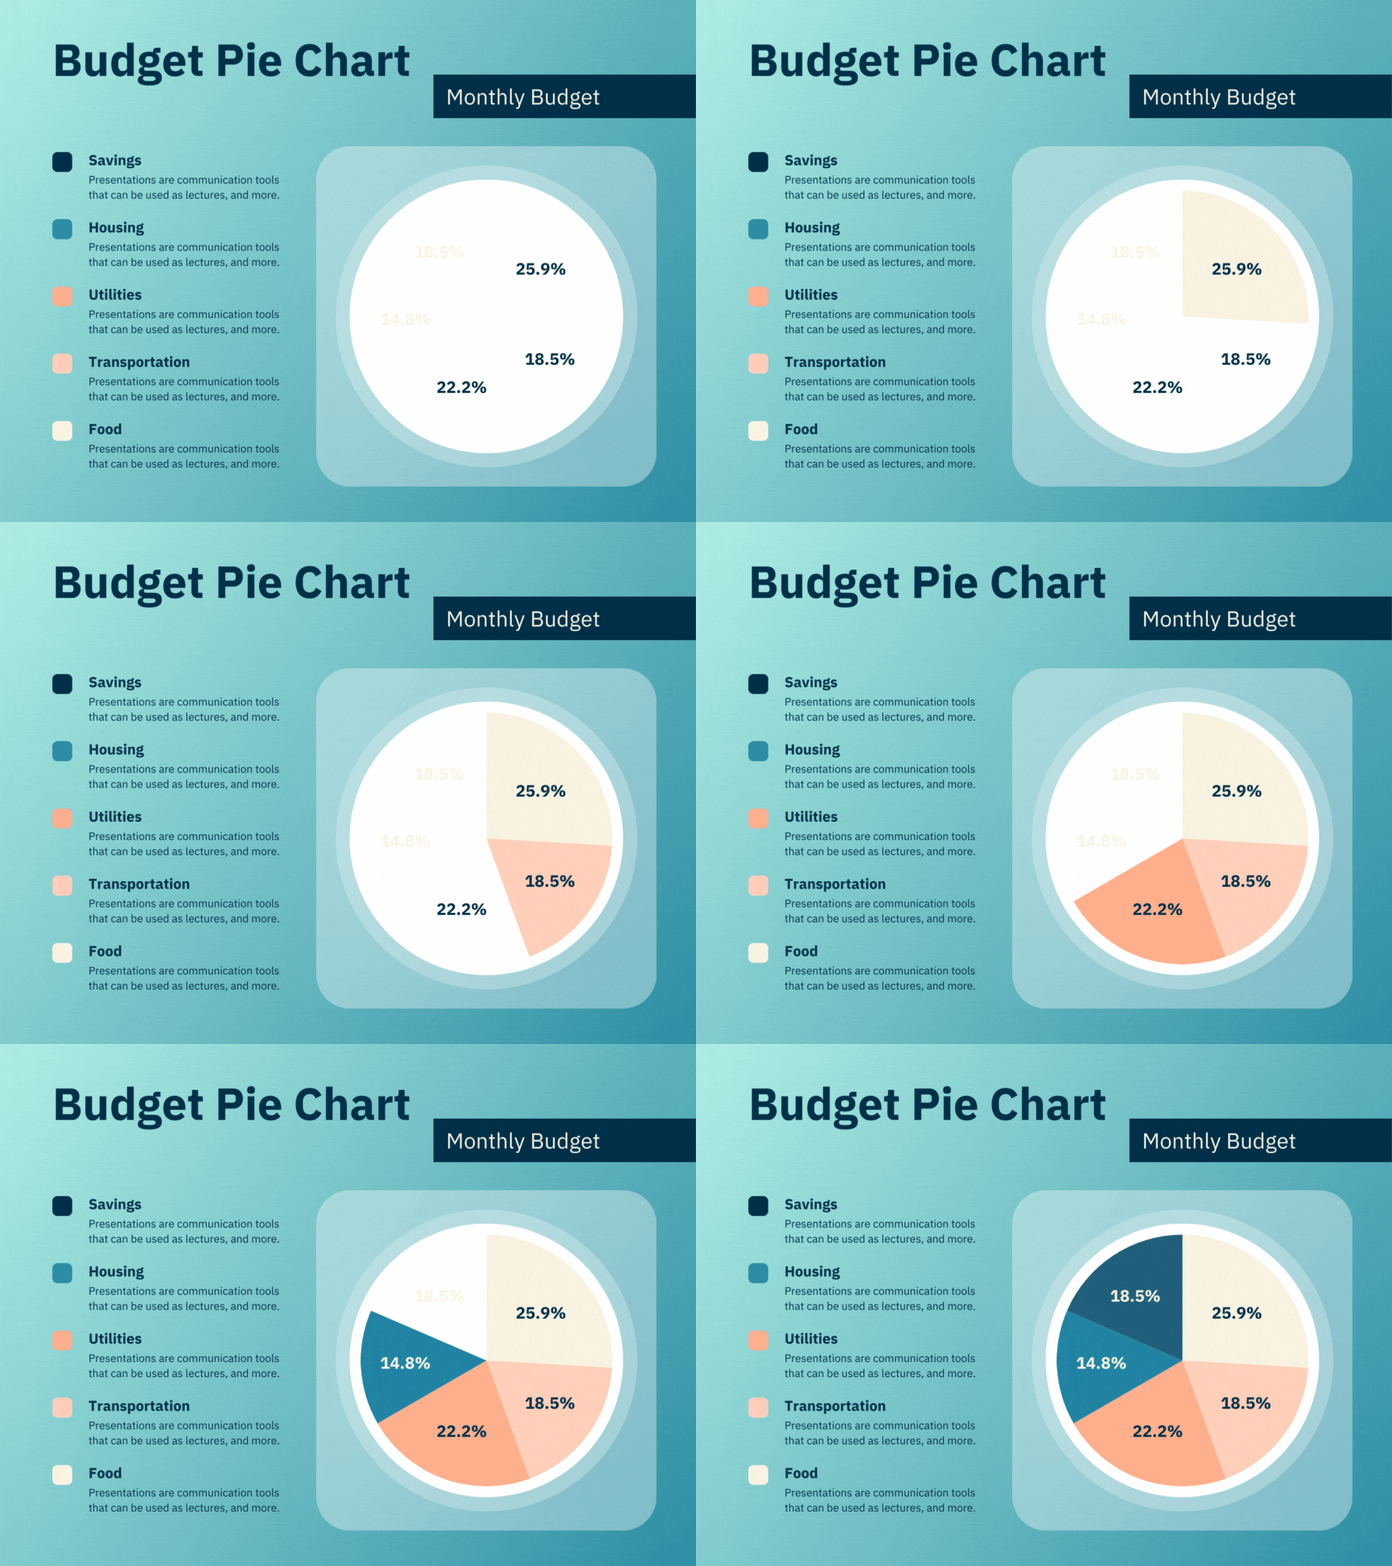
- Budget Tracking: Displays budget allocations, expenditures, and variances to track financial performance against planned budgets.
- Financial Ratios: Includes key financial ratios such as ROI, profitability margins, and liquidity ratios.
- Forecasting: Provides forecasting models and projections based on historical financial data.
Benefits
- Financial Control: Helps manage and control financial performance by providing insights into budget adherence and expenditure patterns.
- Strategic Planning: Assists in strategic financial planning by offering forecasts and trend analysis.
- Risk Management: Identifies financial risks and variances early, enabling corrective actions.
Best Practices
- Accurate Data Integration: Ensure financial data is accurate and integrated from reliable sources.
- Regular Reviews: Conduct regular reviews of financial metrics and forecasts to align with financial goals.
- Clear Visualization: Use clear and concise visualizations to represent financial data effectively.

Explore more about financial dashboards here.
5. Agile Dashboards
Overview
Agile Dashboards are tailored for organizations using Agile methodologies. They focus on tracking Agile metrics and facilitating Agile project management.
Key Features
- Sprint Metrics: Displays metrics related to sprint progress, such as burn-down charts, velocity, and sprint backlog.
- Team Performance: Tracks team performance and productivity metrics, including story points completed and cycle time.
- Issue Tracking: Monitors issues and impediments affecting the Agile process.
Benefits
- Agile Tracking: Provides visibility into Agile processes and metrics, supporting effective Agile project management.
- Enhanced Collaboration: Facilitates team collaboration by sharing progress and performance metrics.
- Continuous Improvement: Supports continuous improvement by tracking performance and identifying areas for enhancement.
Best Practices
- Customize for Agile Teams: Tailor the dashboard to reflect the specific metrics and needs of Agile teams.
- Integrate with Agile Tools: Ensure integration with Agile project management tools for real-time updates.
- Promote Transparency: Use the dashboard to promote transparency and open communication within Agile teams.
Learn more about Agile dashboards here.
6. Risk Management Dashboards
Overview
Risk Management Dashboards focus on identifying, assessing, and managing risks across projects and operations. They provide insights into risk factors and mitigation strategies.
Key Features
- Risk Identification: Displays identified risks, including their potential impact and probability.
- Mitigation Strategies: Tracks the status of risk mitigation actions and their effectiveness.
- Risk Trends: Analyzes trends in risk occurrences and their impact on projects and operations.
Benefits
- Proactive Risk Management: Enables proactive management of risks by providing insights into potential issues and mitigation strategies.
- Improved Risk Visibility: Offers a clear view of risk factors and their status, supporting informed decision-making.
- Enhanced Mitigation: Facilitates effective risk mitigation by tracking the implementation and effectiveness of mitigation strategies.
Best Practices
- Regular Risk Assessments: Conduct regular risk assessments and update the dashboard accordingly.
- Integrate with Risk Management Frameworks: Ensure alignment with organizational risk management frameworks and processes.
- Actionable Insights: Focus on providing actionable insights and recommendations for risk mitigation.
For more on risk management dashboards, visit this resource.

Conclusion
Dashboards are powerful tools that provide valuable insights and facilitate effective management in software development organizations. By utilizing different types of dashboards, such as Project Management, Executive, Operational, Financial, Agile, and Risk Management Dashboards, organizations can enhance their oversight, decision-making, and overall performance. Each type of dashboard serves a unique purpose and offers specific features that cater to the needs of various stakeholders.
Implementing well-designed dashboards requires careful consideration of metrics, data sources, and user needs. By following best practices and focusing on clarity, accuracy, and relevance, organizations can create dashboards that drive better outcomes and support their strategic and operational goals.
Curated Reads:


Very well presented. Every quote was awesome and thanks for sharing the content. Keep sharing and keep motivating others.