
Empowering Team Clarity and Accountability
In the intricate dance of project management, clarity and accountability are key to orchestrating a successful outcome. Imagine a scenario where every team member knows their role, responsibilities, and how they contribute to the bigger picture. This utopian vision is achievable with the help of a tool that has been quietly revolutionizing the way projects are managed: the RACI chart.
A RACI chart, also known as a Responsibility Assignment Matrix, is more than just a diagram. It’s a roadmap that delineates who is Responsible, Accountable, Consulted, and Informed for every task or decision within a project. This tool, though seemingly simple, can transform a disjointed team into a cohesive unit, fostering a sense of ownership and eliminating confusion. The magic of a RACI chart lies in its ability to provide clear answers to the perennial questions that plague projects: Who is doing what? Who makes the decisions? Who needs to be consulted? And who should be kept in the loop?
This article delves into the depths of RACI charts, exploring their structure, benefits, and practical applications in the real world. We will navigate through examples that highlight how different industries leverage RACI charts to streamline their processes, mitigate risks, and enhance collaboration. From software development to healthcare, and from construction projects to marketing campaigns, the versatility of the RACI chart will become evident as we unravel its potential.
In the ensuing sections, we will break down the components of a RACI chart, illustrating how to create one and avoid common pitfalls. By the end of this journey, you will not only appreciate the significance of a RACI chart but also be equipped with the knowledge to implement it effectively within your own projects. So, let’s embark on this exploration to understand how a RACI chart can be a beacon of clarity in the complex world of project management.
The Anatomy of a RACI Chart
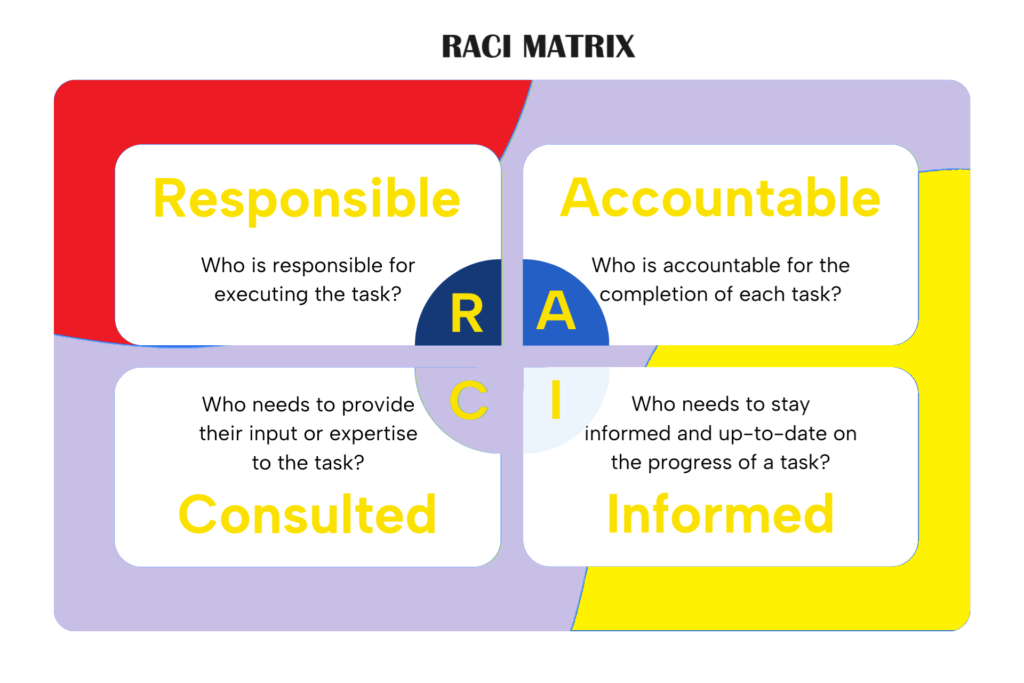
A RACI chart is built on a simple grid format, where tasks or deliverables are listed on one axis, and team members or roles are listed on the other. Each cell within the grid is filled with one of the four RACI letters:
- R (Responsible): The person or people who are responsible for executing the task. This is the doer who completes the work.
- A (Accountable): The person who is ultimately accountable for the task’s completion and its outcome. There is typically only one accountable person per task to avoid confusion.
- C (Consulted): Individuals or groups who need to provide input before the work can be started or completed. These are often subject matter experts or key stakeholders.
- I (Informed): Those who need to be kept informed of the task’s progress or decisions made, but do not contribute directly to the task.
Crafting a RACI Chart
Creating a RACI chart involves several steps:
- Identify Tasks: Break down the project into tasks or deliverables.
- Determine Roles: List all team members or roles involved in the project.
- Assign RACI Values: For each task, assign the appropriate RACI value for each role.
- Review and Validate: Ensure that each task has one, and only one, accountable person and that responsibilities are clearly delineated.
Let’s look at a practical example to illustrate this process.
Real-World Example: Software Development Project
Consider a software development project aimed at creating a new mobile app. The project team includes roles such as Project Manager, Developer, QA Tester, UX Designer, and Product Owner. Here’s how a RACI chart might be structured for this project:
| Task/Deliverable | Project Manager | Developer | QA Tester | UX Designer | Product Owner |
|---|---|---|---|---|---|
| Requirement Gathering | A | C | R | ||
| Design Mockups | C | R | A | ||
| Development | I | R | C | A | |
| Testing | I | R | C | A | |
| Launch | A | I | I | I | R |
Benefits of Using a RACI Chart
- Enhanced Clarity: A RACI chart clearly defines who is responsible for each task, reducing ambiguity and ensuring everyone knows their role.
- Improved Accountability: By assigning accountability, team members are more likely to take ownership of their tasks, leading to better outcomes.
- Better Communication: The chart facilitates communication by specifying who needs to be consulted or informed, preventing information silos.
- Efficient Decision-Making: With roles and responsibilities clearly defined, decision-making becomes more streamlined and efficient.
Practical Usage Across Industries
Healthcare: Managing Patient Care
In a hospital setting, managing patient care involves coordination among doctors, nurses, administrative staff, and specialists. A RACI chart can help ensure that each aspect of patient care is handled efficiently. For instance:
| Task/Deliverable | Doctor | Nurse | Admin Staff | Specialist |
|---|---|---|---|---|
| Patient Admission | A | R | C | I |
| Diagnosis | R | C | I | A |
| Treatment Plan | A | R | I | C |
| Follow-up Care | C | R | I | A |
Construction: Building a New Facility
Construction projects involve multiple stakeholders, including project managers, architects, engineers, and contractors. A RACI chart can clarify responsibilities and ensure smooth project execution:
| Task/Deliverable | Project Manager | Architect | Engineer | Contractor |
|---|---|---|---|---|
| Site Survey | A | R | C | I |
| Design Approval | C | A | R | I |
| Construction | I | C | A | R |
| Quality Inspection | A | I | R | C |
Marketing: Launching a Campaign
Marketing campaigns often require collaboration between marketing managers, designers, content creators, and analysts. A RACI chart ensures that each component of the campaign is managed effectively:
| Task/Deliverable | Marketing Manager | Designer | Content Creator | Analyst |
|---|---|---|---|---|
| Campaign Strategy | A | C | C | I |
| Content Creation | I | C | R | A |
| Design Assets | I | R | C | A |
| Performance Analysis | A | I | I | R |
Common Pitfalls and How to Avoid Them
While RACI charts are powerful tools, there are common pitfalls to watch out for:
- Overcomplicating the Chart: Keep the chart simple and avoid overloading it with too many details.
- Ignoring the Chart: Regularly update and refer to the RACI chart to keep it relevant and useful.
- Misassigning Roles: Ensure that roles are assigned appropriately, with clear distinction between responsible and accountable parties.
- Lack of Consensus: Engage the entire team in creating the RACI chart to ensure buy-in and agreement on responsibilities.
Conclusion
RACI charts are invaluable tools for project management, offering a structured approach to defining and communicating roles and responsibilities. By enhancing clarity, accountability, communication, and decision-making, RACI charts can transform the way teams collaborate and execute projects. From software development to healthcare, and construction to marketing, the practical applications of RACI charts are vast and varied. By understanding their anatomy and learning from real-world examples, you can harness the power of RACI charts to lead your projects to success. Embrace this tool, and watch your team’s productivity and cohesion soar.
Interesting reads